Intraday trading lives and dies
by momentum. When price breaks out of a defined range with conviction, it tends
to move fast and far enough to turn a well-timed entry into a meaningful gain
before the session closes. The challenge is separating real breakouts from the
noise that fills every chart in the first hour of trading. Several well-tested
strategies address this problem in slightly different ways, each suited to
different instruments, sessions, and trader temperaments. This article covers
the most widely used intraday breakout approaches, with the opening range
breakout at the center, alongside other methods active traders rely on daily.
The Opening Range Breakout:
Core Logic and Rules
The
opening range breakout strategy is built on a simple observation: the first
15 to 30 minutes after a major session opens tend to set the directional tone
for the rest of the day. Large participants are positioning during this window,
and the resulting price range, the high and low of that initial period, often
acts as a meaningful support and resistance structure.
The setup works as follows. A
trader waits for the opening range to form, marks its high and low, then
watches for a candle close above the high (long signal) or below the low (short
signal). The entry is confirmed only when the breakout candle's body closes
clearly outside the range, not just wicks through it. If the first breakout
candle straddles the boundary, the next candle must close fully outside before
entry is valid.
Stop-loss placement follows one
of two approaches: either at the midpoint of the opening range, which gives the
trade more room to breathe, or just beyond the high or low of the signal
candle, which is tighter but cuts losses faster when the setup fails.
Take-profit targets are set at 2x and 3x the stop-loss distance, with partial
closes at each level and the remainder moved to breakeven after the first
target is hit. Win rates typically fall in the 40 to 60 percent range, and the
asymmetric reward structure, 2:1 and 3:1, means the strategy can be profitable
even when losing trades slightly outnumber winners.
Where the ORB Works Best and
When to Avoid It
Market selection matters as much
as entry logic. The ORB performs best on liquid instruments with defined
session open times. US stock index futures and individual equities around the
09:30 EST New York Stock Exchange open are the classic environment, where
institutional order flow is heaviest and breakouts tend to follow through. The
London session open, around 07:00 UTC, works well for forex pairs, particularly
EURUSD and GBPUSD, which often see sharp directional moves as European
liquidity enters the market.
The strategy struggles in two
conditions: low-volatility consolidation days when price chops back and forth
without committing to a direction, and days dominated by slow data releases
where price drifts rather than breaks. Checking the economic calendar before
applying ORB each morning is not optional. A high-impact data release can
either amplify a breakout into an unusually strong move, or blow out stops on
both sides before any clear direction emerges.
Adding a directional filter from
a higher timeframe reduces false signals considerably. If the daily chart shows
the instrument in a clear uptrend, taking only long ORB setups aligns the trade
with larger structural momentum. An RSI reading above 50 on the 5-minute chart
at the moment of breakout provides a secondary confirmation that the move has
real momentum behind it, not just a brief spike.
Other Intraday Breakout
Approaches Worth Knowing
The ORB is the most structured of
the intraday breakout strategies, but active traders use several related
approaches depending on the instrument and session.
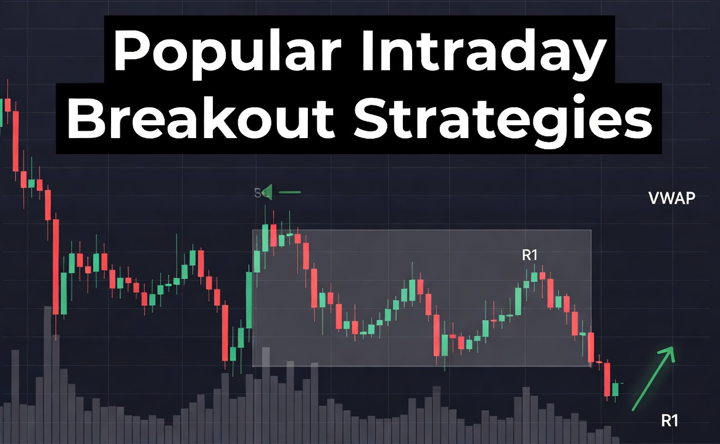
The VWAP breakout works on a
similar logic but replaces the opening range with the volume-weighted average
price as the key level. Price breaking above VWAP with a momentum candle and
expanding volume signals institutional buying. A close back below VWAP reverses
the thesis. This approach is particularly popular with US equity traders
because VWAP resets each day and provides a clean intraday anchor.
Pivot point breakouts use the
previous day's high, low, and close to calculate support and resistance levels
that update daily. A breakout through the first resistance level above the
central pivot, confirmed with volume, is treated as a long signal. The levels
are mathematical rather than market-generated, which makes them easy to apply
mechanically, but the reliability depends heavily on whether other participants
are watching the same levels.
The table below compares the
three approaches across key parameters:
|
Strategy
|
Key reference level
|
Best instruments
|
Confirmation tool
|
Typical stop placement
|
|
Opening Range Breakout
|
Range high or low
|
Index futures, forex majors
|
Candle close outside range
|
Range midpoint or signal candle
|
|
VWAP Breakout
|
VWAP line
|
US equities, ETFs
|
Volume spike
|
Below VWAP retest
|
|
Pivot Point Breakout
|
R1/S1 levels
|
Forex, index futures
|
RSI, momentum candle
|
Below pivot or S1
|
No single approach dominates
across all conditions. Traders who understand all three can select the setup
most appropriate for the day's market structure rather than forcing one method
into conditions that do not suit it.
Managing Risk on Intraday
Breakout Trades
All three strategies share the
same core vulnerability: false breakouts. Price pierces a key level, triggers
entries, then reverses sharply and stops out the position before the intended
move develops. Reducing false breakouts is not a matter of finding a perfect
indicator. It is a matter of applying multiple independent filters
simultaneously.
Volume confirmation is the most
reliable filter on instruments where volume data is available. A breakout on
significantly above-average volume suggests genuine commitment from
institutional participants. A breakout on thin volume, especially around a round
number, is more likely to be short-lived. For forex pairs, where volume data is
less clean, momentum indicators like RSI and the shape of the breakout candle
carry more weight.
Position sizing must be
calculated before entry, not after. With a 1 to 2 percent account risk limit
per trade and the stop-loss distance already defined by the strategy rules, the
position size is a simple arithmetic result. Traders who skip this step and
choose position size by feel tend to take oversized losses on the inevitable
false breakouts, which erodes the statistical edge of the strategy over time.
One practical discipline that
experienced traders develop: if two consecutive stop-outs occur in a single
session on the same instrument, the session is closed for that instrument.
Consecutive losses on the same day often indicate that the market is in a
choppy, low-conviction state that is hostile to breakout strategies regardless
of how well the setup looks on the chart.
Conclusion
Intraday breakout strategies work
because markets do have directional tendencies at specific times of day,
particularly around major session opens and key institutional reference levels.
The opening range breakout captures the momentum that forms in the first 30
minutes of a session. VWAP and pivot point methods extend the same logic
throughout the trading day using different reference levels. What distinguishes
consistent traders from those who burn through accounts chasing breakouts is
the discipline to confirm signals, size positions correctly, and stop trading
when conditions turn unfavorable. The edge in these strategies is real, but it
only survives when the rules are followed without exception.
 Releases Monitor
 Broadcast locally signed transactions
 FAQ
FAQ Halving countdown
 Add Blockexplorer.one to your website
 Bitcoin
 Ethereum
 Bitcoin Cash
 Litecoin
 DogeCoin
 Dash
Dash
 Ethereum Classic
 Binance Smart Chain
 Tron
Tron
 ZCash
ZCash
 XRP
XRP


 Scan QR