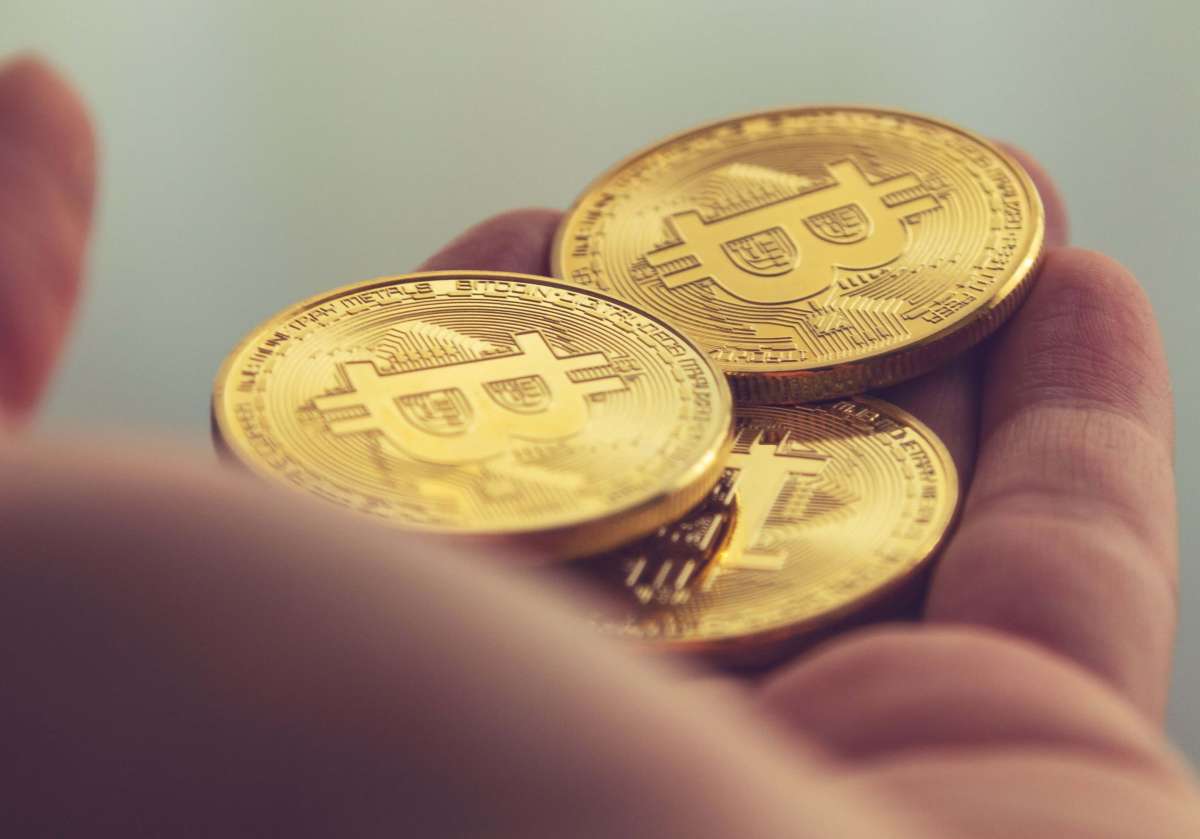
Bitcoin produces a constant
stream of public data. Every transaction, block and fee leaves information
behind that can be examined on the blockchain. The current Bitcoin
price is useful to know, but it doesn't tell you what's happening
across the network itself. Comparing different types of data can reveal more
about what's happening on the network.
Bitcoin price and market data
Bitcoin's price is an easy place
to start. A large price move can happen alongside changes in trading activity
or investor behavior, so checking the current price gives you a useful
reference point when looking at network data.
Market capitalization is based on
Bitcoin's circulating supply and market price, while trading volume shows how
much Bitcoin has been traded during a particular period.
Neither figure tells you exactly
what's happening on the blockchain. Bitcoin can rise in price without a
corresponding jump in transactions, for example. Keeping market data separate
from on-chain data helps avoid reading too much into any one movement.
Transaction volume and
activity
Every Bitcoin transaction adds to the public record. Transaction activity can
give a fairly direct indication of how busy the network is at a given time.
Transaction count is the number
of transactions processed during a particular period. A higher figure might
mean more activity, but the reason isn't always obvious. It could be payments,
exchange activity or transactions generated by a particular service.
The size of those transactions
matters too. A day filled with thousands of small transfers isn't quite the
same as one with fewer transactions moving much larger amounts of Bitcoin.
Transaction count alone won't show that difference. The amount being transferred
is therefore useful to check alongside transaction count.
Block time and confirmation
data
Bitcoin transactions have to be
included in blocks before they're added to the blockchain. The network aims for
an average of roughly 10 minutes between blocks, although the actual gap
varies.
Some blocks arrive after only a
few minutes. Others take longer. Bitcoin's difficulty adjustment helps keep the
average close to its target over time.
Confirmations are another figure
you'll encounter when examining transactions. The first comes when a
transaction is included in a block. Further blocks added to the chain increase
its confirmation count.
When checking a transaction, the
count shows how far it has progressed. Block data can also give a broader view
of network activity.
Bitcoin transaction fees
A Bitcoin
transaction can include a fee to encourage miners to pick it up and add
it to a block.
Fees can change quite a bit. When
transactions are competing for limited block space, a user might offer higher
fees to improve their chances of being processed sooner. With fewer
transactions waiting, that pressure can ease.
Rising transaction numbers and
fees can point to stronger competition for available block space. A high fee
doesn't explain itself, though. Transaction counts and block activity can help
show what's behind the change.
Hash rate and mining activity
Hash rate refers to the computing
power being used to mine Bitcoin. It's measured in hashes per second and
changes as miners add, remove or replace equipment.
For anyone looking at Bitcoin
mining, it's a useful figure to follow. A higher hash rate means more computing
power is being used in the mining process.
Mining difficulty is closely
related. Bitcoin adjusts the difficulty periodically to keep block production
close to its intended average.
The two figures shouldn't be
confused. Hash rate describes computing power, while difficulty describes how
demanding the mining process is.
Active addresses
Address activity gives another
glimpse into what's happening on the network. Looking at addresses involved in
transactions over a particular period can reveal changes in activity. The
numbers need to be treated carefully, though. One person can use multiple
Bitcoin addresses, and an exchange can operate addresses used by many
customers.
An increase in active addresses
therefore doesn't mean the same number of new users have appeared. The metric
can still be useful over longer periods. Comparing address activity with
transaction data may reveal changes that aren't obvious from a single figure.
Putting Bitcoin metrics
together
No single Bitcoin metric gives
you the full picture. Imagine transaction activity rises at the same time as
fees and the number of busy blocks. That's quite different from a sharp move in
Bitcoin's price while on-chain activity barely changes.
Timeframe matters too. One
unusually busy day might not mean much. A similar pattern continuing for
several weeks is harder to dismiss as a temporary spike. There's no single
formula for analyzing Bitcoin. The useful part is knowing what each figure measures
and checking how the numbers relate to one another.
Making sense of Bitcoin data
Reliable blockchain information
gives users a better starting point for this kind of analysis. Blockchain
explorers allow people to inspect transactions, blocks and network statistics
directly rather than relying entirely on simplified summaries.
Developers might use an explorer
to investigate a transaction. Investors can examine network activity, while
cryptocurrency enthusiasts can see what's happening on the blockchain for
themselves.
Price, transactions, fees,
blocks, mining activity and addresses each show a different side of Bitcoin.
They give a fuller view of the network.
 Releases Monitor
 Broadcast locally signed transactions
 FAQ
FAQ Halving countdown
 Add Blockexplorer.one to your website
 Bitcoin
 Ethereum
 Bitcoin Cash
 Litecoin
 DogeCoin
 Dash
Dash
 Ethereum Classic
 Binance Smart Chain
 Tron
Tron
 ZCash
ZCash
 XRP
XRP


 Scan QR